2026 benchmarks for e-commerce support: response times, CSAT, cost per ticket, and resolution rates by store size. Compare your Shopify store's CX performance.
E-commerce Customer Support Benchmarks 2026: Response Times, Resolution Rates & Costs
Your support team just crushed it this quarter. Average response time: 3 hours. CSAT: 74%. Cost per ticket: $5.10. The team's proud.
They shouldn't be. Every one of those numbers is below the 2026 benchmark for e-commerce. And your competitors (the ones eating into your repeat purchase rate) probably know it.
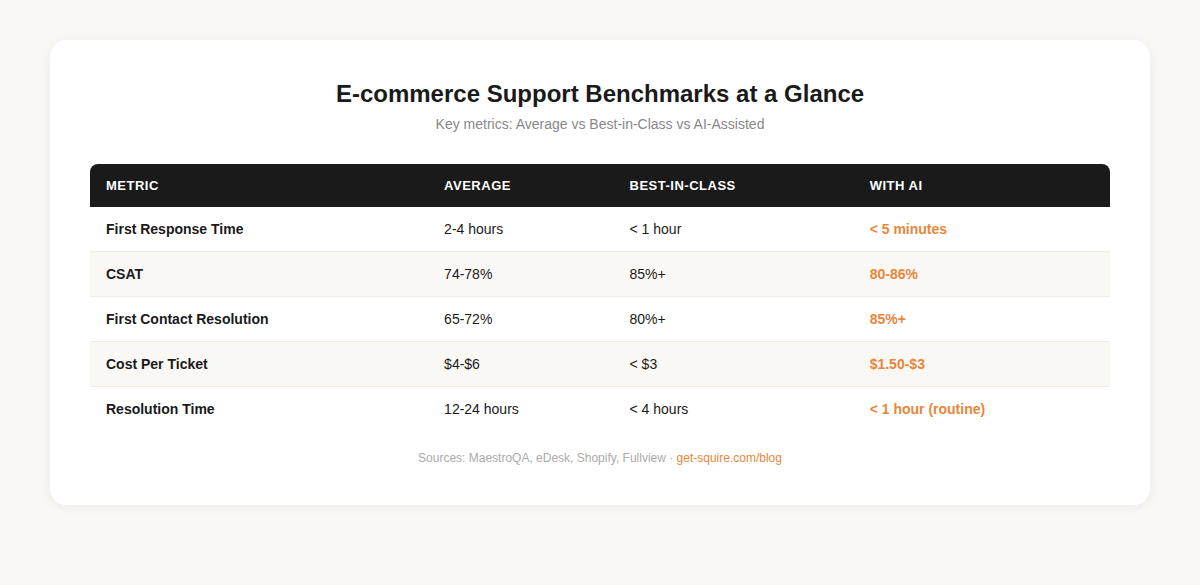
Here's the problem with running support without benchmarks: you have no idea whether your "good" is actually good. A 3-hour first response feels fast until you learn that stores using AI support hit under 5 minutes. A 74% CSAT feels solid until you see that top-performing Shopify stores sit above 85%.
We pulled data from MaestroQA, Shopify's own research, eDesk, Gartner, and a handful of CX reports we trust. Then we organized these e-commerce customer support benchmarks the way nobody else has: by store size, by channel, and with a clear line between what's achievable with humans alone versus humans plus AI.
No stat dumps. No filler. Just the numbers that matter and what to do about them.
Curious how your store compares? Book a quick benchmark review with Squire →
Why Benchmarks Matter More Than They Did Two Years Ago
Support used to be the cost center nobody wanted to manage. You hired reps, kept the queue from exploding, and called it a day.
That math doesn't work anymore. Two things changed.
First, customer expectations reset. According to Shopify, nearly a third of online shoppers now expect a response within one hour. 38% expect it immediately, within minutes. Not "same business day." Not "within 24 hours." Minutes. And 89% of consumers will switch brands after a single bad support experience, per Salesforce's State of the Connected Customer report.
Second, AI made world-class support accessible to stores that aren't running 50-person CX teams. When a $2M Shopify store can deploy an AI agent that answers WISMO tickets in 8 seconds, the benchmark for acceptable response time moves. For everyone.
So if you're managing CX for a Shopify store and haven't looked at industry benchmarks since 2024, you're operating on expired data.
The Six Metrics That Actually Predict Revenue
Not every metric matters equally. We've seen stores obsess over ticket volume while ignoring cost per resolution, which is like tracking steps on a Fitbit while eating pizza for every meal. Here are the six that correlate with actual business outcomes.
First Response Time (FRT)
What it measures: the gap between a customer submitting a ticket and receiving their first real reply. Auto-acknowledgments don't count.
The e-commerce average sits around 4–6 hours for email, per eDesk's 2025 data. Live chat is faster, typically under 3 minutes for stores that staff it properly. But here's the thing: 72% of shoppers want resolution on first contact (Forrester), not just a fast "we got your message."
Speed without substance is a vanity metric.
Customer Satisfaction Score (CSAT)
CSAT is the simplest metric and still one of the most reliable predictors of repeat purchases. You ask customers to rate their experience, usually on a 1–5 scale, right after the conversation closes.
eDesk puts the industry average at roughly 76% (3.8 out of 5). Fullview's research pins "excellent" CSAT performance at 80% or higher. The gap between 76% and 85% sounds small, but it's the difference between customers who tolerate you and customers who recommend you.
One pattern we've noticed: stores that respond fast but resolve slowly (lots of "let me check on that" messages) score worse on CSAT than stores that take 30 minutes longer to respond but nail it on the first reply.
First Contact Resolution (FCR)
Percentage of tickets resolved without follow-up. This is the metric your agents probably hate tracking because it exposes every "I'll get back to you on that" message.
Industry average for e-commerce: around 68%, according to eDesk. Best-in-class stores push past 80%. AI-assisted teams regularly hit 85%+ because the AI resolves the straightforward stuff (WISMO, order status, return eligibility) on the first message with zero ambiguity.
Every unresolved ticket at least doubles your handling cost. The customer writes back. An agent re-reads the thread. Context gets lost. Resolution takes 2–4× longer. If your FCR is below 70%, that's where we'd focus before touching anything else.
Cost Per Ticket
This is the number your CFO actually cares about. Total support spend divided by resolved tickets.
MaestroQA's 2024 Call Center Cost Study pegs the e-commerce range at $2.70–$5.60 per ticket. That's already one of the lowest across industries (healthcare sits at $15+, financial services at $10+). But it adds up. A store processing 3,000 tickets per month at $5 each is spending $180,000 a year on support. Drop that to $2 per ticket with AI automation on routine queries and you're saving $108,000. Not theoretical savings. Real ones.
Labor makes up 60–80% of that cost. The rest is software, training, and overhead. Which means the fastest path to reducing cost per ticket isn't squeezing your agents harder; it's having AI handle the tickets that don't need a human in the first place.
Average Resolution Time (ART)
Total time from ticket creation to closed-resolved. This is distinct from FRT. You might respond in 5 minutes but take 3 days to actually resolve the issue if it requires escalation, supplier coordination, or a replacement shipment.
Benchmarks:
- Below average: > 48 hours
- Average: 12–24 hours
- Good: 4–12 hours
- Best-in-class: < 4 hours (routine tickets resolved in < 1 hour with AI)
WISMO tickets, which represent 18-30% of all e-commerce support volume (Gorgias data), should resolve in under 2 minutes with AI. If yours take longer, something's broken.
Ticket-to-Order Ratio
Underrated metric. How many support tickets does your store generate per 100 orders?
- Average: 10–15 tickets per 100 orders
- Optimized: 6–8 per 100
- Best-in-class: < 5 per 100
Stores with high ratios usually have a UX problem, not a support problem. Confusing shipping estimates, missing tracking emails, unclear return policies. Fix those and you reduce ticket volume before support even touches it.
Proactive AI notifications (order shipped, out for delivery, delay detected) can cut this ratio by 30–40% on their own.
Benchmarks by Store Size
Generic e-commerce customer support benchmarks are a starting point. But a $200K Shopify store and a $10M one face completely different realities. Here's how the numbers break down.
Small Stores (Under $500K/year)
Typical team: the founder, maybe a VA, and a whole lot of personal email replies.
The honest truth? Most stores at this size don't track support metrics at all. They respond when they see the notification, which could be 15 minutes or 15 hours depending on what else is on fire that day.
The real cost here isn't dollars. It's founder time. Every hour answering "where's my order?" is an hour not spent on marketing, product, or operations. We talked to a DTC skincare brand doing $400K/year that was spending 12 hours per week on support. That's a part-time job. For answering the same five questions.
AI support makes the biggest relative impact at this tier. Not because the ticket volume is high (it's usually 100-300/month), but because the person answering tickets has a $200/hour opportunity cost. If you're exploring what AI support looks like in practice, our guide on how to set up AI customer support on Shopify walks through it in 15 minutes.
Mid-Size Stores ($500K–$5M/year)
This is where support gets real. You've got 2–5 agents, probably using Gorgias or Zendesk, and the ticket queue grows faster than your team.
The pattern we see here: stores hire more reps to keep up, which pushes cost per ticket higher because of onboarding, training, and inconsistency between agents. Agent #3 gives different answers than Agent #1. Customers notice. (This inconsistency is one reason stores switch from legacy helpdesks to AI-native platforms, as we covered in Gorgias vs Squire.)
AI flips this equation. Instead of hiring Agent #4, you let AI handle the 60% of tickets that follow a predictable pattern. Your existing team focuses on the stuff that actually requires judgment: angry customers, product defects, complex returns with exceptions. Same headcount, 3× throughput.
Large Stores ($5M+/year)
Teams of 5–20+ agents. Dedicated CX managers. Proper helpdesk tooling. The metrics are better, but the stakes are higher.
The biggest pain at this tier isn't speed. It's consistency. When you have 15 agents across two shifts, brand voice drifts. Agent A is warm and empathetic. Agent B sounds like a legal document. Training helps, but it's a constant battle, especially with turnover rates in CX that frequently hit 30-45% annually.
AI solves this in a way humans can't. Every AI response follows the same brand voice, every time, at 3 AM on a Sunday. It doesn't have a bad day. It doesn't go on vacation. And it handles the routine volume so your senior agents can focus on the interactions that build (or save) customer relationships.
AI vs. Manual Support: The Benchmark Gap
This is where it gets interesting. We pulled numbers from multiple sources to compare what human-only teams achieve versus teams using AI for frontline support.
That CSAT improvement surprises people. The assumption is that customers prefer humans. And for complex, emotional issues (a damaged wedding gift, a missing anniversary present) they do. But for "where's my order?" and "how do I return this?" customers overwhelmingly prefer a correct answer in 30 seconds over a friendly answer in 4 hours.
Gartner's March 2025 research predicts agentic AI will autonomously resolve 80% of common customer service issues by 2029. We're not there yet, but e-commerce is closer than most industries because the ticket types are so predictable. WISMO, returns, exchanges, order status, shipping questions. These follow patterns that AI handles exceptionally well.
The stores pulling ahead right now aren't asking "should we use AI?" That debate ended in 2024. They're asking "how much of our volume can AI handle before we need to intervene?" For a deeper comparison of the tools in this space, see our best AI chatbots for Shopify roundup.
Tools like Squire are built for exactly this split. The AI handles WISMO, returns, order status, and shipping questions autonomously, pulling real data from your Shopify admin, not regurgitating FAQ text. Your team handles the tickets that need a human. All channels, one inbox, no per-seat fees.
The Cost of Being Below Benchmark
Let's make this concrete with a worked example.
Say you're a Shopify store doing $3M/year. You process about 4,000 orders per month with a 12% ticket-to-order ratio. That's 480 support tickets monthly.
Your current numbers:
- FRT: 4 hours (average)
- Cost per ticket: $5.20 (3 agents at $45K + software)
- CSAT: 73%
- FCR: 65%
Now let's calculate what that 65% FCR costs you. With 480 tickets and 35% requiring follow-up, that's 168 tickets bouncing back. Each follow-up costs roughly 1.5× the original ticket (re-reading, context rebuilding, additional replies). So you're spending an extra $1,310/month ($15,720/year) just on unresolved first contacts.
But the bigger cost is invisible. Research from PwC shows 32% of customers will stop doing business with a brand after one bad experience, even if they previously loved it. If slow support causes even 2% of your customers to churn (on a $3M store with, say, a $120 average LTV) that's $72,000 in lost lifetime revenue per year.
Compare that to the cost of hitting benchmark numbers with AI support:
That's $63,000+ in combined savings and retained revenue. For a $3M store. The AI helpdesk costs maybe $150–$350/month. The ROI isn't a question.
How to Measure Your Own Performance Against These Benchmarks
If you've made it this far through these e-commerce customer support benchmarks and realized you don't actually track half of these metrics, don't panic. Most Shopify stores don't. But setting up tracking takes about five minutes if you have the right tool.
The Five-Minute Setup
Any modern helpdesk — Squire, Gorgias, Zendesk, even Help Scout — tracks FRT, CSAT, and resolution time automatically. You don't need custom dashboards or data engineers. Just make sure:
- CSAT surveys are turned on. Post-resolution, in-widget or via email. If you're not asking, you're guessing.
- First response time is measured from ticket creation, not from when an agent first opens it. Big difference.
- Cost per ticket includes everything. Agent salaries + benefits + software + training, divided by resolved tickets. Not just "software cost."
If you're still using a shared Gmail inbox for support (and roughly 40% of stores under $1M are), you're flying blind. No FRT tracking, no CSAT, no FCR measurement. Moving to a helpdesk is step one.
The Monthly Check-In
Pull your numbers monthly. Compare against the benchmarks above. Look for trends, not snapshots. A single bad week during a product launch doesn't define your support quality.
Set one improvement target per quarter. Not four. Not seven. One. "Reduce FRT from 4 hours to 90 minutes." Hit that, then pick the next one.
When AI Support Pays for Itself
Simple decision framework: if any two of these are true, AI support will pay for itself within 90 days.
- FRT is above 2 hours
- Cost per ticket is above $4
- Your team is at capacity and you're considering hiring
- FCR is below 70%
- You can't offer 24/7 support but your customers expect it
A 14-day free trial removes the risk. Test it against your own benchmarks, not someone else's marketing claims.